Carbon Emissions
HKEX KPI A1.2, A1.5
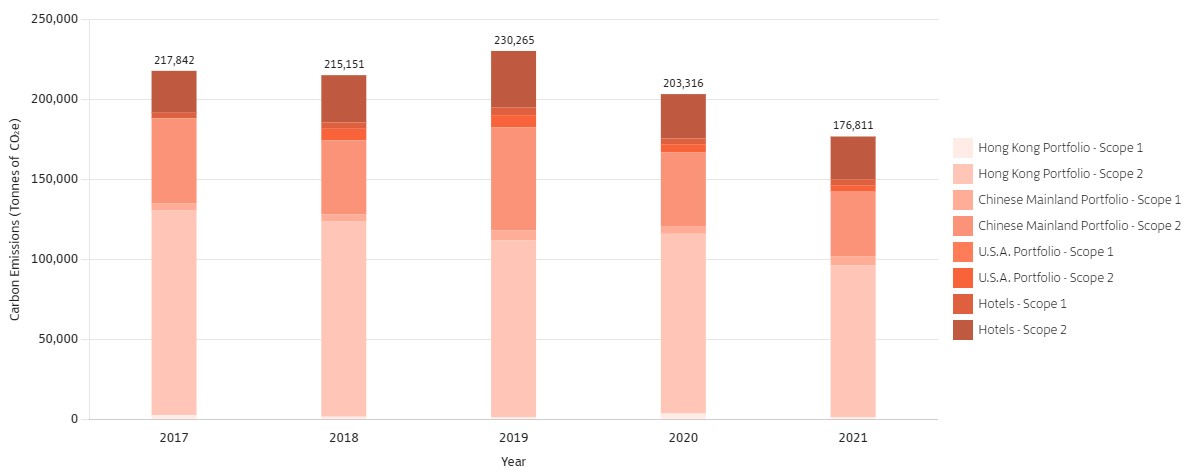
In 2021, our total carbon emissions decreased by 13% compared to 2020. The total carbon intensity in our Hong Kong, Chinese Mainland and U.S.A. portfolios and hotels decreased by 25% compared to 2020.
The Company’s largest source of carbon emissions under our control is Scope 2 emissions arising from purchased electricity. This category of emissions decreased by 13% compared to 2020 and this is attributed to various initiatives including the adoption of innovative low-carbon technologies, improved energy management, and the procurement of renewable electricity expanding to 100% at Taikoo Hui in Guangzhou and The Temple House in Chengdu.
For further information about our progress against SBTs and efforts in reducing our carbon emissions, please click here.
Carbon Emissions of Portfolios 2017-2021
Carbon Intensity of Portfolios 2017-2021
Carbon Emissions - Scope 3
Swire Properties is conscious of our direct and indirect emissions at various stages along the value chain. Besides measuring Scope 1 (i.e. direct carbon emissions from energy combustion on-site) and Scope 2 carbon emissions (i.e. indirect carbon emissions from electricity purchased and used), we have conducted comprehensive reviews of Scope 3 emissions (i.e. indirect emissions that occur along the value chain) since 2018 to understand our emission sources and identify the associated material categories for management and reporting.
From our review, we identified that the most significant sources of our Scope 3 emissions are Category 2 - Capital Goods and Category 13 - Downstream Leased Assets, as categorised by the Greenhouse Gas (“GHG”) Protocol:
Scope 3 Emissions by Category
To address the two most significant categories of Scope 3 emissions, we established science-based reduction targets to reduce the emissions generated by capital goods and downstream leased assets by 25% and 28% per square metre respectively by 2030.
The disclosure of our Scope 3 emissions is included in this report to present a more holistic view of the Company's carbon footprint along the value chain. This data has been included in our SD Report since 2020 – please refer to Performance Data Summary for details. While Swire Properties may have limited influence or control over some of our Scope 3 emissions categories, we will continuously monitor these emissions, particularly if they begin to represent an increasing portion of our total carbon footprint.
Energy Use Intensity
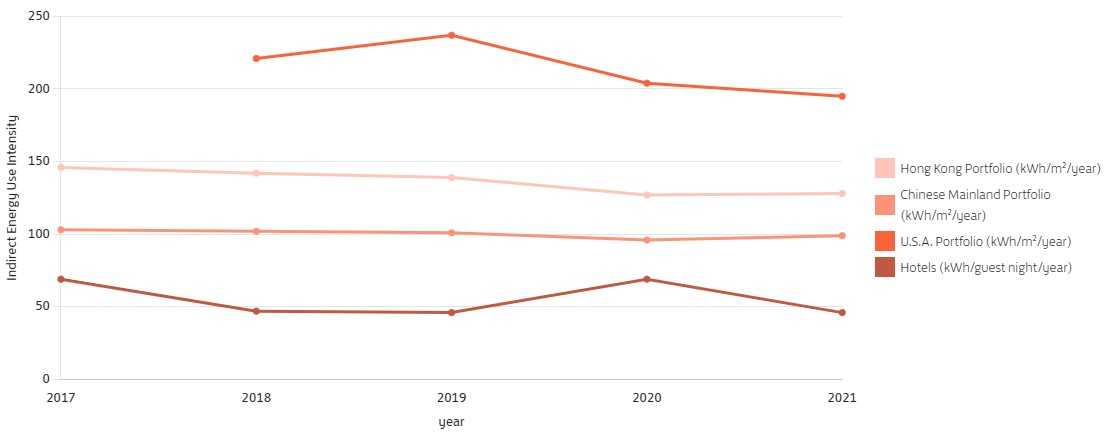
In 2021, our energy use intensity25 decreased by 35%, from 194 kWh per square metre (“kWh/m2”) per year to 126 kWh/m2 per year across our global portfolios, as compared to our 2008 baseline year.
In 2021, the energy use intensity in our Hong Kong portfolio (including hotels) decreased by 7% as compared to our 2019 baseline year.
Energy Use Intensity
(including hotels)
In 2021, the energy use intensity in our Chinese Mainland portfolio (including hotels) decreased by 3% as compared to our 2019 baseline year.
Energy Use Intensity
(including hotels)
25 | Energy use intensity refers to electricity consumption (per square metre) for the provision of shared services for and in the common parts of ours buildings. |
26 | Compared to the 2019 baseline. |
Indirect Energy Use Intensity of Portfolios 2017-2021
For further information about our energy reduction initiatives, please click here. |
Water Use
HKEX KPI A2.2, A2.4
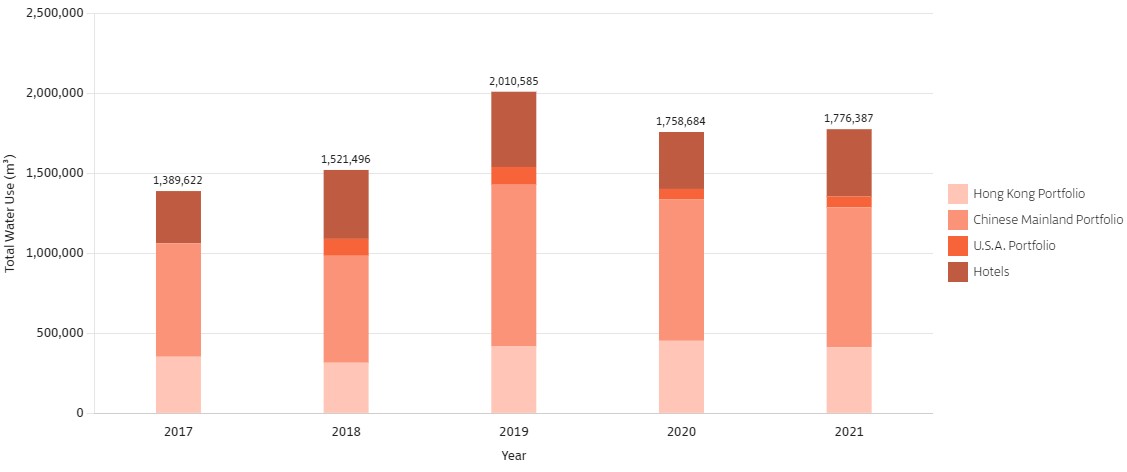
In 2021, the total water usage in our portfolios in Hong Kong and the Chinese Mainland decreased by 3.8% as compared to 2020. The total water intensity in these portfolios have also decreased - this is partially due to the replacement of a faulty water pipe in March 2021. This was accomplished after liaising with multiple government departments, district councillors and an estate management company.
The water intensity in our hotel operations decreased in 2021 as compared to 2020. We attribute this decrease, in part, to the relative increase in the number of guest nights during the period when the COVID-19 pandemic situation improved for a time in 2021.
When measured against our 2025 KPI, the water intensity of the Hong Kong portfolio increased by 4.7% in 2021 as compared to the 2016 BAU baseline. This increase is attributed to the opening of the Citygate Outlets extension in 2021, a shopping mall with a relatively higher water intensity.
The water intensity in our Chinese Mainland portfolio decreased by 20.1% compared to the 2016 BAU baseline. This achievement is attributed to better monitoring enabled by the introduction of sub-metering in our buildings and from the ongoing recycling of grey water and rainwater.
In our hotels, the water intensity in 2021 has increased by 6.6% as compared to the 2018/2019 baseline used for our 2025 KPI. This increase is attributed to the reduced number of guest nights when compared to the baseline, since travel and tourism have been greatly impacted by COVID-19.
Total Water Use of Portfolios 2017-2021
Water Use Intensity of Portfolios 2017-2021
Water Intensity
- Our Hong Kong portfolio refers to our office and retail portfolios in Hong Kong, excluding hotels; our Chinese Mainland portfolio refers to our office and retail portfolios in the Chinese Mainland, excluding hotels; our U.S.A. portfolio refers to our retail portfolio in the U.S.A., excluding hotels.
- The water intensity reduction targets set for our Hong Kong portfolio and Chinese Mainland portfolio reference 2016 as the BAU water consumption baseline year.
- The water intensity reduction targets set for our hotels reference 2018/2019 as the water consumption baseline year.
- The 2018 total water use and water intensity of our U.S.A. portfolio has been adjusted to exclude tenants' water use.
Materials Used
By Projects Under Development in 2021
- Projects under development refers to projects that are under construction or in the pre-certification stage.
- Includes investment properties under development in all portfolios, including joint venture and non-joint venture projects.
- “Diesel consumption” includes biodiesel consumption.