Profile of Environmental Impacts
HKEX KPI A3.1
Profile of Environmental Impacts
HKEX KPI A3.1
Carbon Emissions
GRI 305
HKEX KPI A1.2, A1.5
HKEX KPI A1.2, A1.5
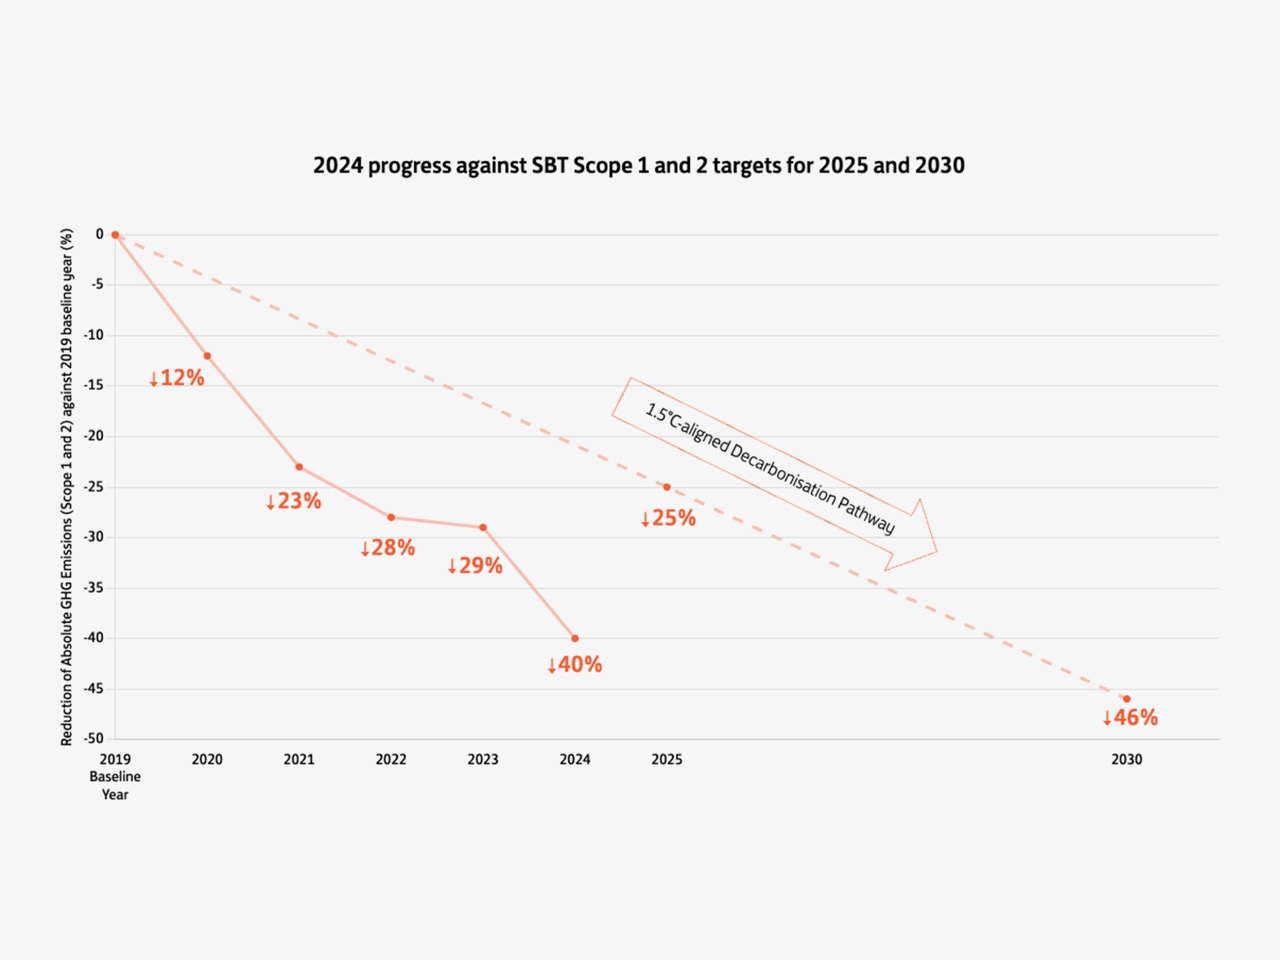
In 2024, our total carbon emissions decreased by 15% compared to 2023. Carbon emissions for the like-for-like portfolio have decreased by 16% from 2023 to 2024. The carbon intensity of our Hong Kong portfolio, Chinese Mainland portfolio, U.S.A. portfolio and Hotels decreased compared to 2023.
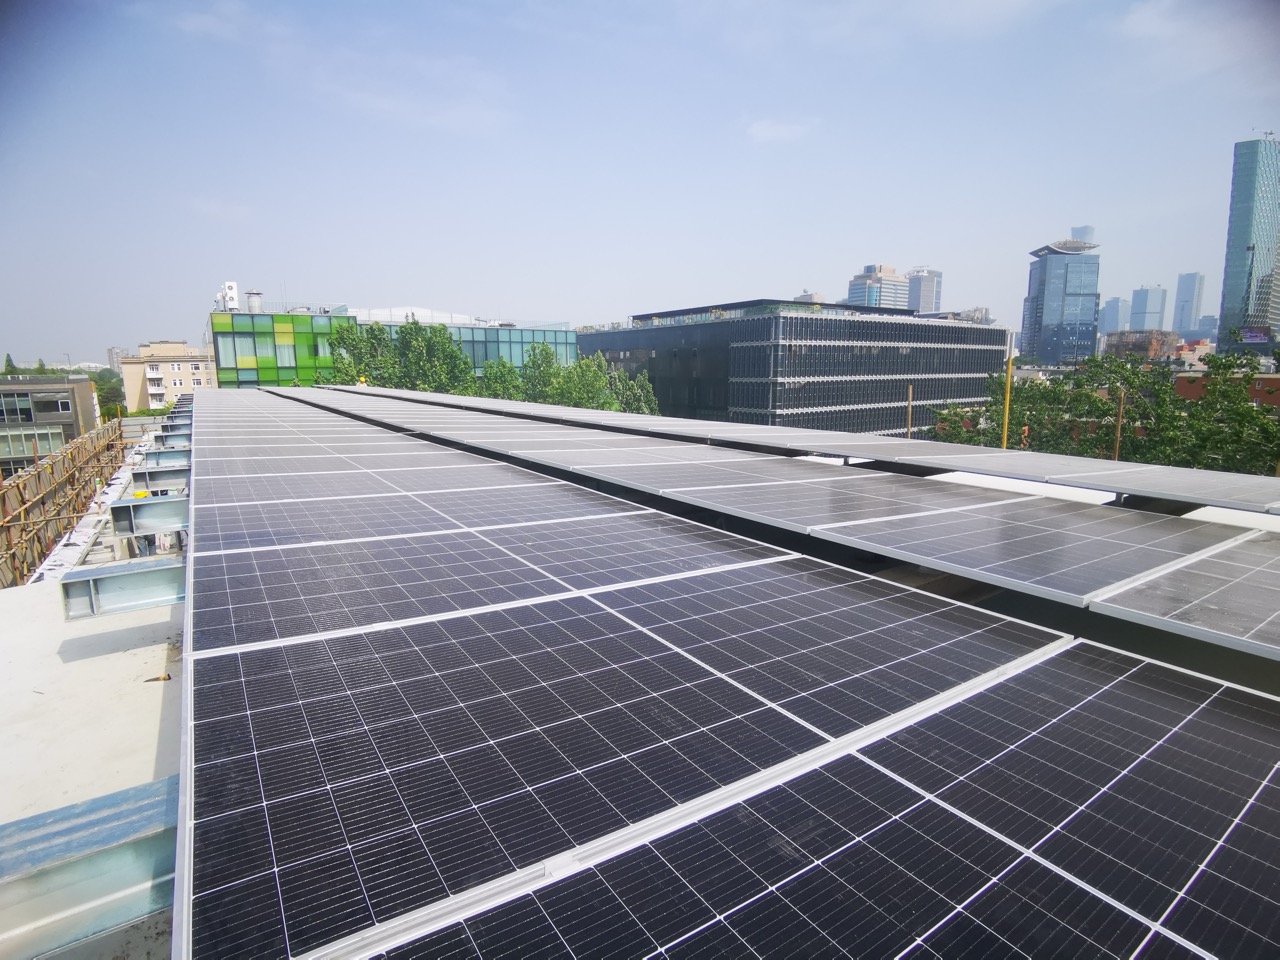
The Company’s largest source of carbon emissions under our control is Scope 2 emissions arising from purchased electricity, this category of emissions decreased by 15.2% compared to 2023. This is attributed to various initiatives including the rollout of innovative low-carbon technologies such as the Photovoltaic, Energy Storage, Direct Current, and Flexible (“PEDF”) power distribution system at Taikoo Li Sanlitun and Taikoo Hui Guangzhou, continued retrofitting works and better energy management practices across our portfolios and an increase in procurement of renewable electricity at Taikoo Li Sanlitun and INDIGO - approaching nearly 100% in 2024.
For further information about our progress against SBTs and efforts to reduce our carbon emissions, please click here.
Carbon Emissions – Scope 3
Swire Properties is conscious of our direct and indirect emissions at various stages along the value chain. Besides measuring Scope 1 (direct carbon emissions from energy combustion on-site) and Scope 2 carbon emissions (indirect carbon emissions which mainly come from the purchase and use of electricity). We have conducted comprehensive reviews of our Scope 3 emissions (indirect emissions that occur along the value chain) to understand our emission sources and identify the associated material categories for management and reporting.
Scope 3 Emissions by Category
To address our Scope 3 emissions, we have established science-based targets (“SBTs”) to reduce the emissions generated by capital goods and downstream leased assets by 25% and 28% per square metre respectively by 203032.
Category 1’s contribution to our total scope 3 emissions increased from 27% in 2023 to 33.4% in 2024, reflective of the company’s progress in procurement of goods and services, to support its HKD100 billion investment plan. To better manage our Category 1 emissions, Swire Properties’ Business Partner Sustainability Programme is a key initiative that allows us to effectively improve the data transparency, accuracy and reliability of the Scope 3 emissions generated from our supply chain. In 2023, 60 of our significant suppliers were invited to provide relevant information including their carbon management systems, strategy and performance.
As part of our sustainable procurement strategy, we have introduced low-carbon specifications for new developments, detailing such specifications for concrete, reinforcement bar and structural steel. We also provide sustainable procurement guidelines to our procurement team in Hong Kong and the Chinese Mainland for non-key materials and services such as office equipment and catering. This empowers them to consider environmental performance during the procurement of goods and services.
Category 2 emissions associated to the upfront embodied carbon emissions of our new development project, contributes to 7% of our Scope 3 emissions. The emissions were attributed by the completion of Six Pacific Place, our latest redevelopment project in Hong Kong.
Our Category 13 emissions percentage contribution decreased by 14% from 2023, reflecting the success of our tenant engagement efforts in various SD initiatives, and also the increase in off-site renewable electricity purchase for our tenant operations at INDIGO and Taikoo Li Sanlitun to nearly 100% in 2024.
This data has been included in our Sustainability Report since 2020 – please refer to Performance Data Summary for details. While Swire Properties may have limited influence or control over some of our Scope 3 emissions categories, we will continuously monitor these emissions and seek opportunities to influence them in a positive direction, particularly if they begin to represent an increasing portion of our total carbon footprint.
Electricity Use Intensity
GRI 302
HKEX KPI A2.1
HKEX KPI A2.1
In 2024, our electricity use intensity33 decreased by 43%, from 194 kilowatt hours per square metre (“kWh/m2”) per year to 112 kWh/m2 per year across our global portfolios compared to our 2008 baseline year.
The electricity use intensity in our Hong Kong portfolio (including hotels) decreased by 19% compared to our 2019 baseline year. The electricity use intensity in our Chinese Mainland portfolio (including hotels) decreased by 9% as compared to our 2019 baseline year.
Electricity consumption for the like-for-like portfolio have decreased by 2% from 2023 to 2024.
Electricity Use Intensity
2025 Target34
2024 Progress
Hong Kong Portfolio
(including hotels)
(including hotels)
20%
19%
Chinese Mainland Portfolio
(including hotels)
(including hotels)
13%
9%
Hong Kong Portfolio
(including hotels)
(including hotels)
2025 Target34
20%
2024 Progress
19%
Chinese Mainland Portfolio
(including hotels)
(including hotels)
2025 Target34
13%
2024 Progress
9%
For further information about our energy-reduction initiatives, please click here.
Water Usage
GRI 303
HKEX KPI A2.2, A2.4
HKEX KPI A2.2, A2.4
In 2024, the total water usage in our portfolios in Hong Kong and the Chinese Mainland remained steady compared to last year, with an increase by a slight 0.2%. Water consumption for the like-for-like portfolio have decreased by 1% from 2023 to 2024.
When measured against our 2025 KPI, the water intensity of our Hong Kong portfolio decreased by 14% in 2024 compared to the 2016 baseline. During the year, we continued to install smart water monitoring systems across our portfolios to understand the water consumption patterns for our tenants and common areas, including toilets and irrigation points which helped inform our ongoing system configuration works.
At Two Taikoo Place, recycled rainwater and greywater are used for irrigation. Coupled with the recycle of processed water from the cooling tower, the three systems is capable to reduce fresh water demand in the office tower by approximately 52%.
The water intensity in our Chinese Mainland portfolio decreased by 23% compared to the 2016 baseline. This reflects the efforts of our water saving initiatives, including upgrades to the wastewater treatment plants at Taikoo Li Chengdu and Taikoo Hui Guangzhou, as well as enhancements to the rainwater recycling system at HKRI Taikoo Hui.
In our hotels, the water intensity in 2024 decreased by 11% compared to the 2018/2019 baseline used for our 2025 KPI. Our continued analysis and management of water consumption in guest room areas, restaurants, and public areas, has helped in reducing overall water usage.
Water Intensity
2025 Target
2024 Progress
Hong Kong Portfolio
10%
14%
Chinese Mainland Portfolio
20%
23%
Hotels
8%
11%
Hong Kong Portfolio
2025 Target
10%
2024 Progress
14%
Chinese Mainland Portfolio
2025 Target
20%
2024 Progress
23%
Hotels
2025 Target
8%
2024 Progress
11%
Remarks:
- Our Hong Kong portfolio refers to our office and retail portfolios in Hong Kong, excluding hotels; our Chinese Mainland portfolio refers to our office and retail portfolios in the Chinese Mainland, excluding hotels; our U.S.A. portfolio refers to our retail portfolio in the U.S.A., excluding hotels.
- Water intensity reduction targets reference the water consumption baseline year of 2016.
Materials Used
GRI 301-1
Materials Used by Projects Under Development in 2024

679,682 m3
Concrete

62,220 tonnes
Reinforcement bar

18,527 m3
Timber (100% sourced from certified sustainable timber in Hong Kong projects under development)

10,298 MWh
Electricity consumption

1,221,377 litres
Diesel consumption

460,305 m3
Water consumption
Remarks:
- “Projects under development” refers to projects that are under construction or in the pre-certification stage.
- Includes investment properties under development in all portfolios, including joint venture and non-joint venture projects.
- “Diesel consumption” includes biodiesel consumption.
SEE MORE IN